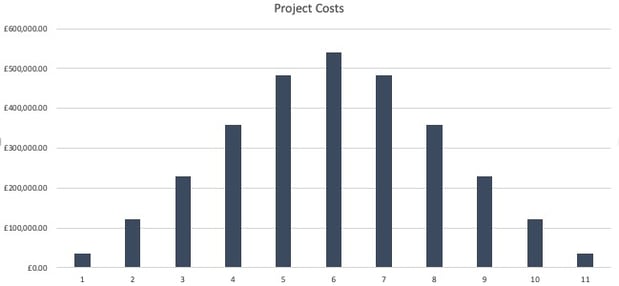
You may have heard about an S-curve, you may not have. The main thing you need to know is that it relates to the shape produced by the typical flow of costs on a property development project.
This is an example showing the flow of project costs after the site acquisition. They start off small, then as the project kicks off the costs increase and then the taper off again towards the end.

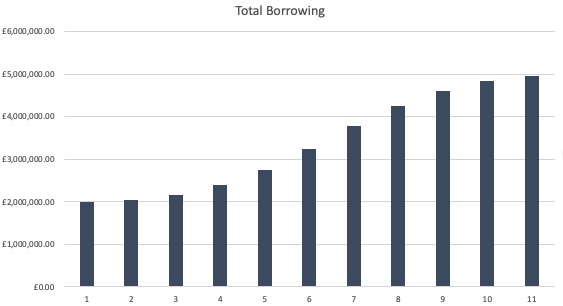
When we look at these costs on a cumulative basis - or as this chart shows, on the amount borrowed for the development finance - you can see that it resembles an S shape.

Why does this matter?
The interest on development finance is usually calculated on the drawn balance (how much money you are actually using).
If a development had a lot of upfront costs, it would significantly increase the cost of borrowing. For example: if you were using modular construction and had to make a large upfront payment to the manufacturer.
Equally, if your project had a bit of a slow start - with things like infrastructure, or a period waiting for permissions at the beginning - it would reduce the cost of the borrowing because you are borrowing the majority of the money needed for a shorter length of time.
How can I calculate my development finance costs with an S-Curve?
This is where we come in. Aprao has been designed to help you quickly and accurately estimate the likely costs of interest on development finance.
With one click you can apply an S-curve to your development feasibility, and see your estimated interest costs.


Leave a comment